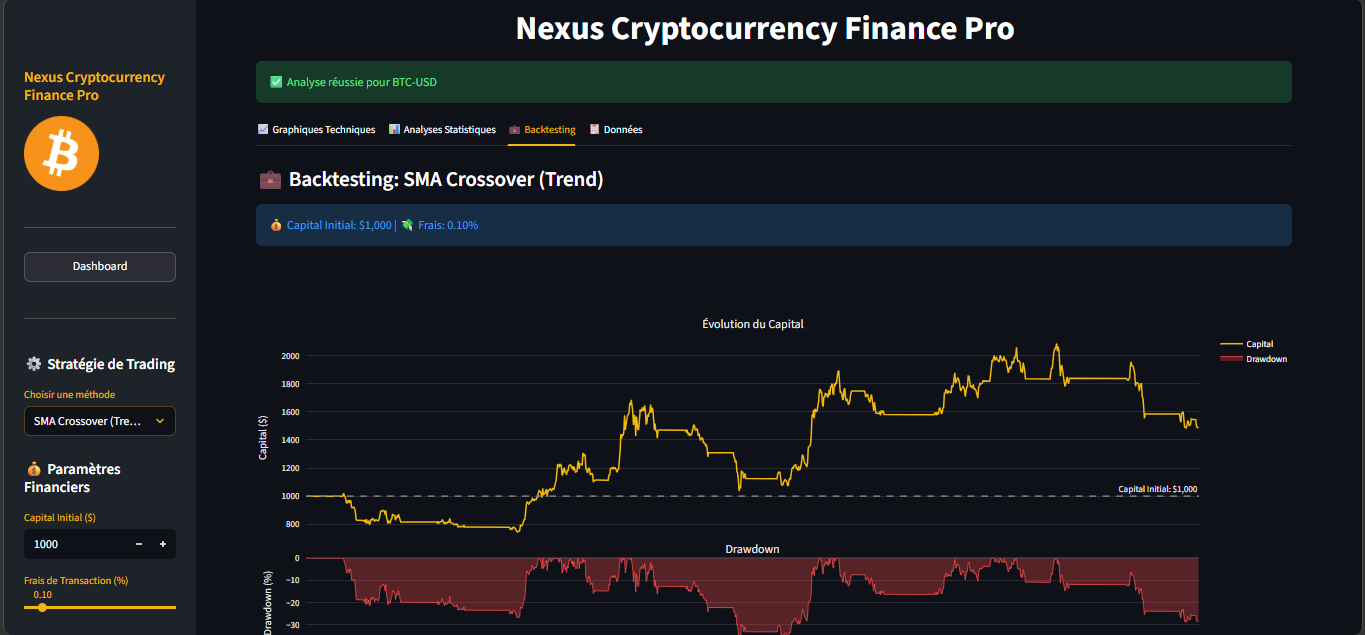
Nexus Crypto Quant Analysis & Backtesting Platform
Developed a quantitative analysis and backtesting platform for cryptocurrency trading strategies. The project allows users to simulate trading performance using historical market data, evaluate strategy profitability, and analyze key metrics such as returns, drawdown, and risk. Built with Python and data analysis libraries, the platform provides interactive visualizations to support data-driven decision making.
Module-by-Module Breakdown
Fetched real-time crypto data using APIs and analyzed price trends using Pandas to identify patterns and trading opportunities.
Developed and tested various trading strategies using historical data to evaluate their performance and profitability.
Evaluated the performance of trading strategies using key metrics such as Sharpe ratio, Sortino ratio, and maximum drawdown.
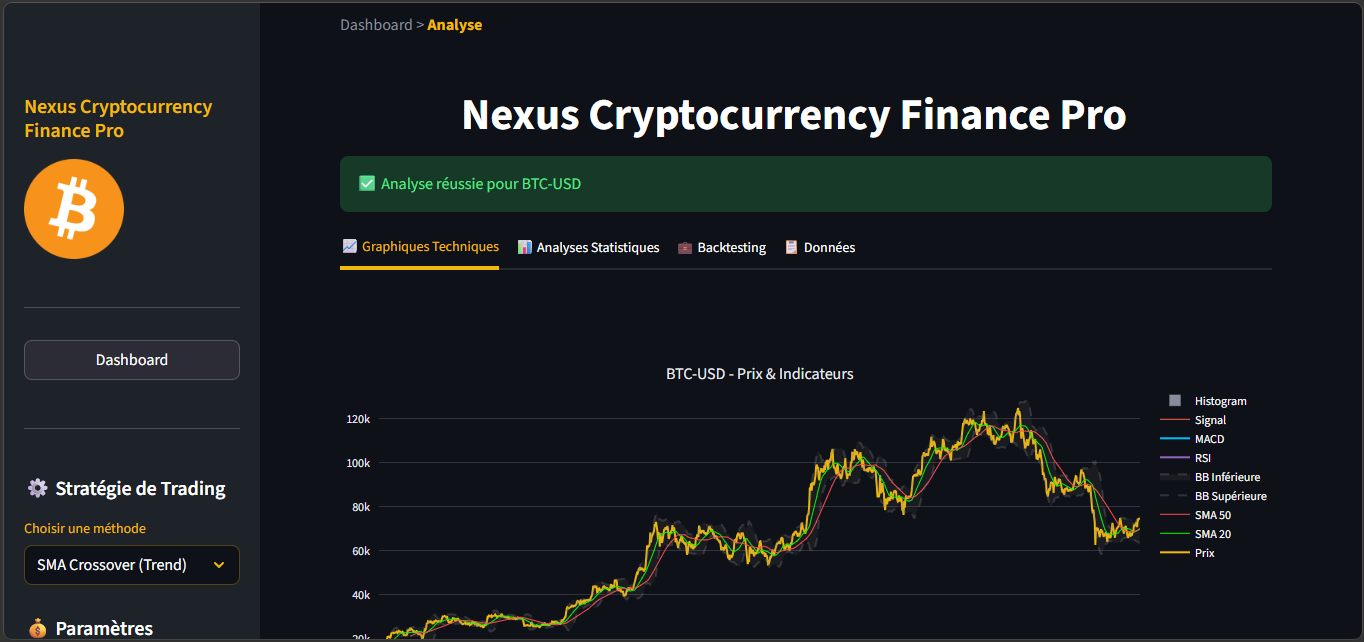
Created interactive visualizations to display market data and strategy performance. Ensured that charts provide meaningful insights for decision-making.
Calculated RSI, Moving Averages, and other indicators for data-driven trading decisions and signal generation.
Tested different trading strategies (SMA Crossover, etc.) to ensure correct selection and execution. Verified that switching between strategies updates results dynamically without errors.
Validated historical cryptocurrency data fetching via API. Ensured data accuracy, correct formatting, and proper handling of missing or inconsistent data.
Implemented and validated technical indicators (e.g., Moving Averages), ensuring accurate calculations and correct representation in data visualizations.
Validated core backtesting logic by simulating trades based on selected strategies. Ensured correct execution of buy/sell signals and accurate profit/loss calculation.
Tested calculation of portfolio metrics including total return, capital evolution, and profit percentage. Verified results match expected outputs.
Validated drawdown calculation and visualization. Ensured maximum loss periods are correctly identified and displayed in charts.
Developed and tested interactive chart visualizations for financial data, ensuring accurate rendering, real-time responsiveness, and clear representation of key performance metrics.
Validated user inputs such as initial capital, strategy parameters, and transaction fees. Ensured input validation and real-time updates in results.
Developed and tested simulation of trades including entry/exit points and fees. Verified correct application of trading rules and accurate balance updates.
My Tasks
Analyzed cryptocurrency datasets using Pandas and NumPy to identify market trends and patterns.
Built and tested a backtesting engine to simulate and evaluate trading strategies using historical data.
Integrated APIs (Yahoo Finance / Crypto APIs) to fetch and process real-time market data.
Designed and developed interactive dashboards using Streamlit for data exploration and analysis.
Created dynamic visual charts to display price trends, indicators, and trading signals.
Optimized application performance to efficiently handle large datasets and computations.
Implemented and validated technical indicators such as Moving Averages and RSI for trading analysis.
Tested strategy performance by evaluating metrics such as ROI, drawdown, and risk levels.
Ensured data accuracy and consistency between API responses and visualized results.
Performed debugging and issue resolution to improve system reliability and stability.
Validated user inputs (capital, parameters, fees) to ensure correct calculations and outputs.
Enhanced user experience by improving UI responsiveness and interaction flow.
Developed and validated the backtesting logic by comparing expected and actual results to ensure accuracy, consistency, and reliability of trading strategies.
What I Learned
Quantitative Analysis
Gained a strong understanding of analyzing financial data and applying quantitative methods to evaluate trading strategies and market trends.
Backtesting & Strategy Validation
Learned how to design, test, and validate trading strategies using historical data to measure performance, accuracy, and risk.
API Integration & Data Handling
Improved skills in working with APIs to fetch real-time data, process datasets, and ensure data accuracy and consistency.
Technical Indicators
Learned how to implement and validate technical indicators such as Moving Averages and RSI for data-driven trading decisions.
Data Visualization
Enhanced ability to create interactive and meaningful visualizations to analyze price movements, trends, and performance metrics.
Performance Optimization
Learned how to optimize data processing and improve application performance when working with large datasets.
QA Mindset in Data Projects
Developed a testing mindset by validating results, comparing expected vs actual outputs, and ensuring accuracy in trading simulations.
Debugging & Problem Solving
Strengthened problem-solving skills by identifying issues in logic, data inconsistencies, and improving system reliability.
Risk Management
Learned how to evaluate and manage trading risks by analyzing metrics such as drawdown, volatility, and capital exposure.
Trading Logic & Signal Interpretation
Developed a deeper understanding of trading signals (buy/sell) and how strategy logic translates into real market actions.
Project Screenshots (20)
Interested in working together?
I'm available for freelance projects and full-time opportunities.
Hire Me